Analytics & dashboard
Track the performance of your automations with detailed statistics.
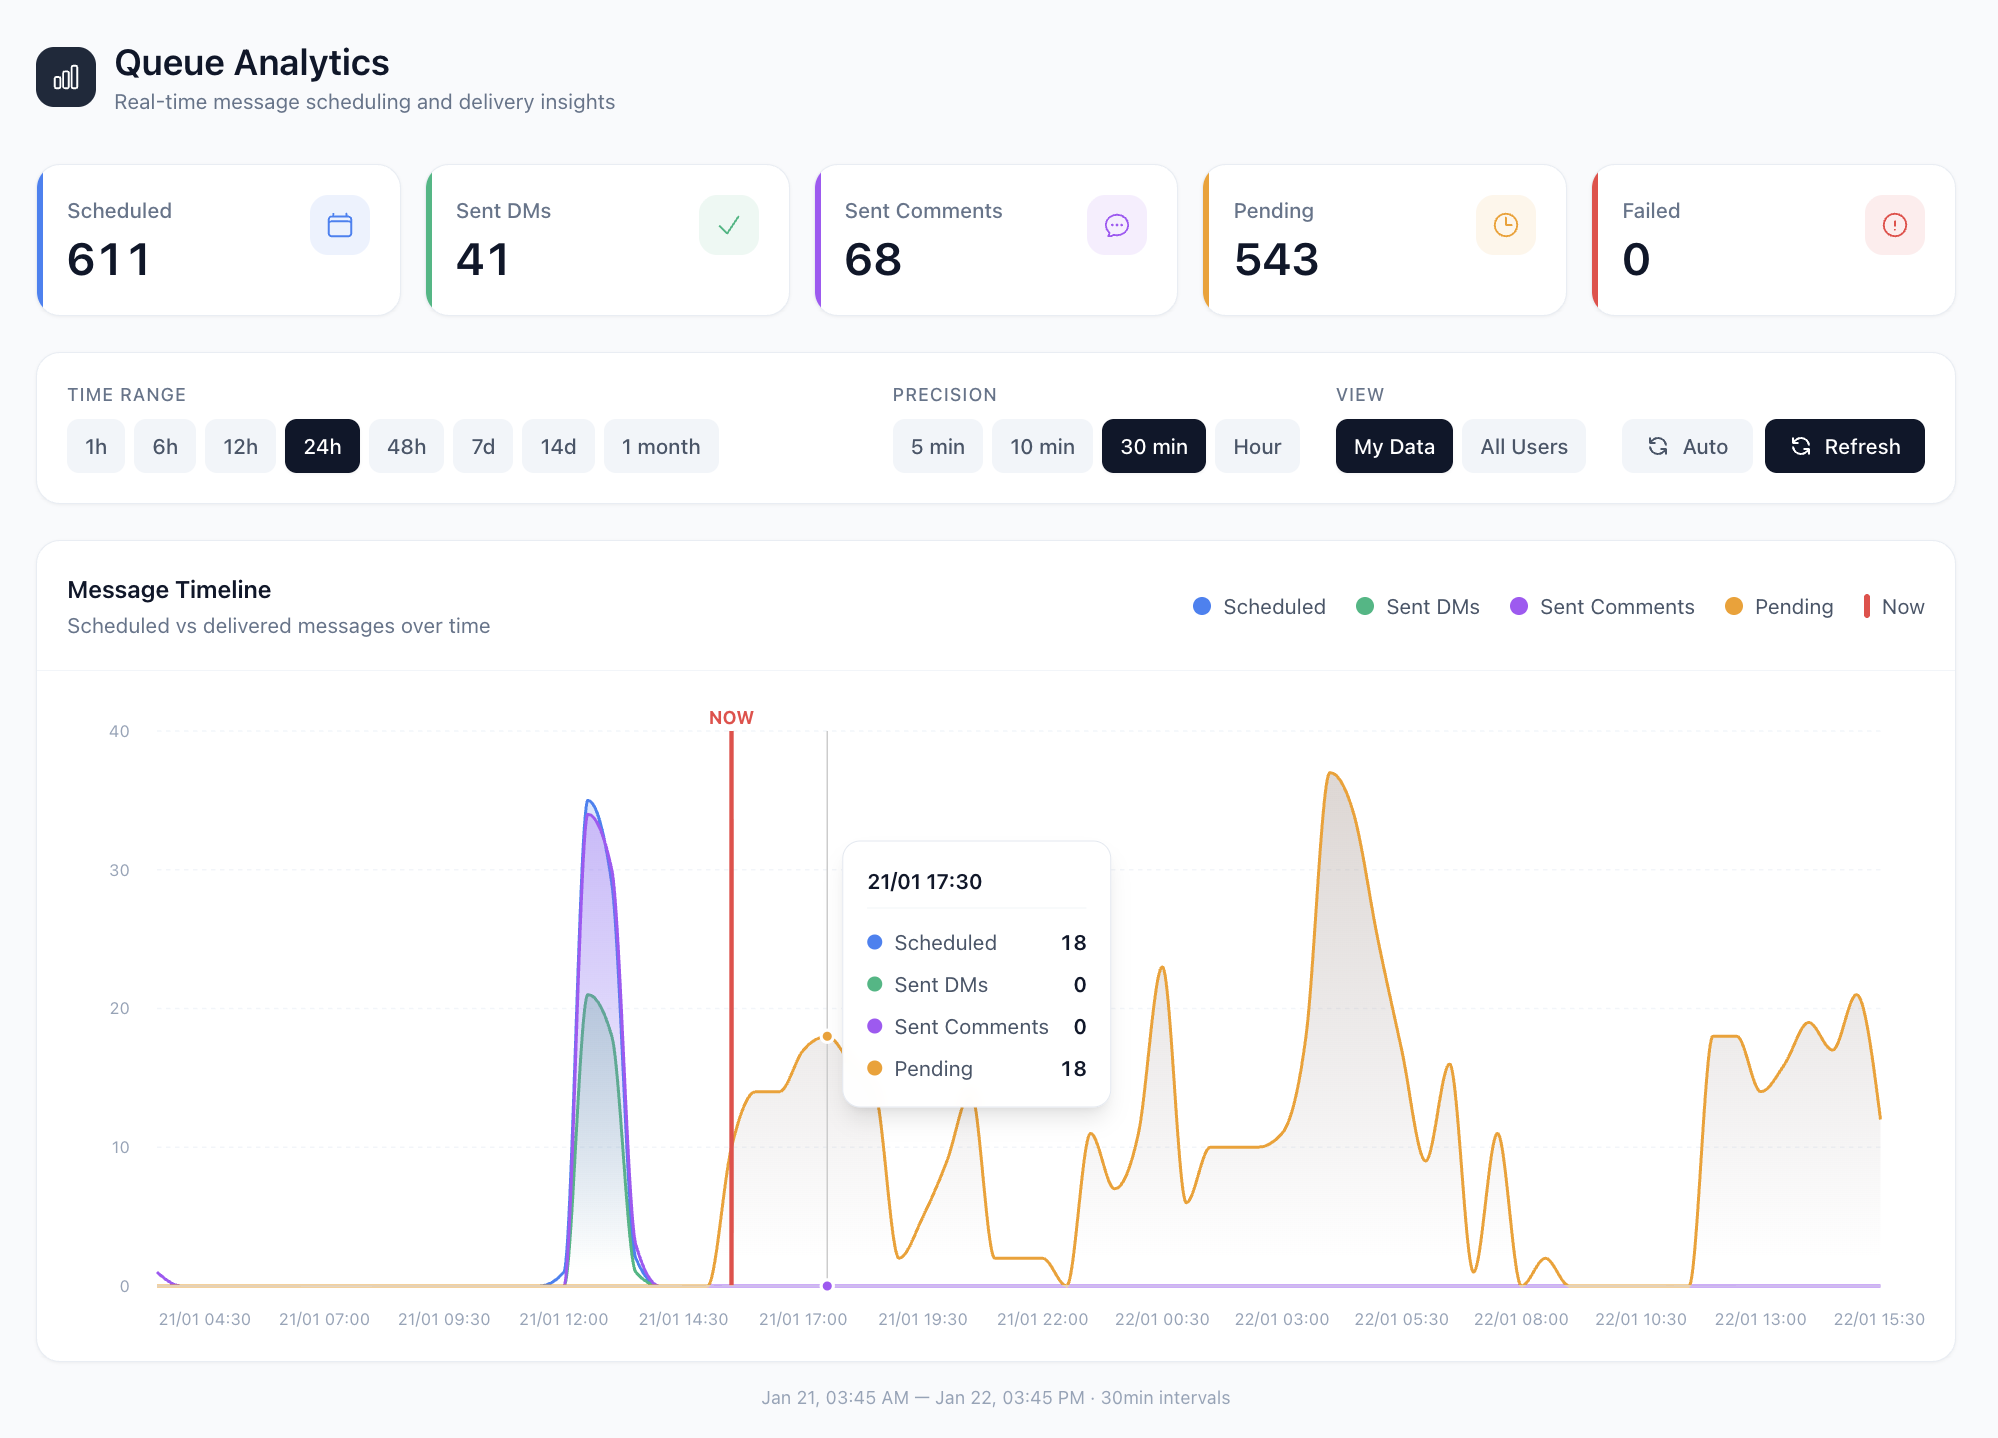
Lead Gravity gives you a comprehensive dashboard to track the performance of your automations in real time.
Overview
The dashboard displays your key metrics: number of DMs sent, comments posted, leads captured, and response rate — all for the period of your choice.
7-day activity
The 7-day activity chart lets you visualize the daily evolution of your sends. You can identify the most active days and adjust your quotas accordingly.
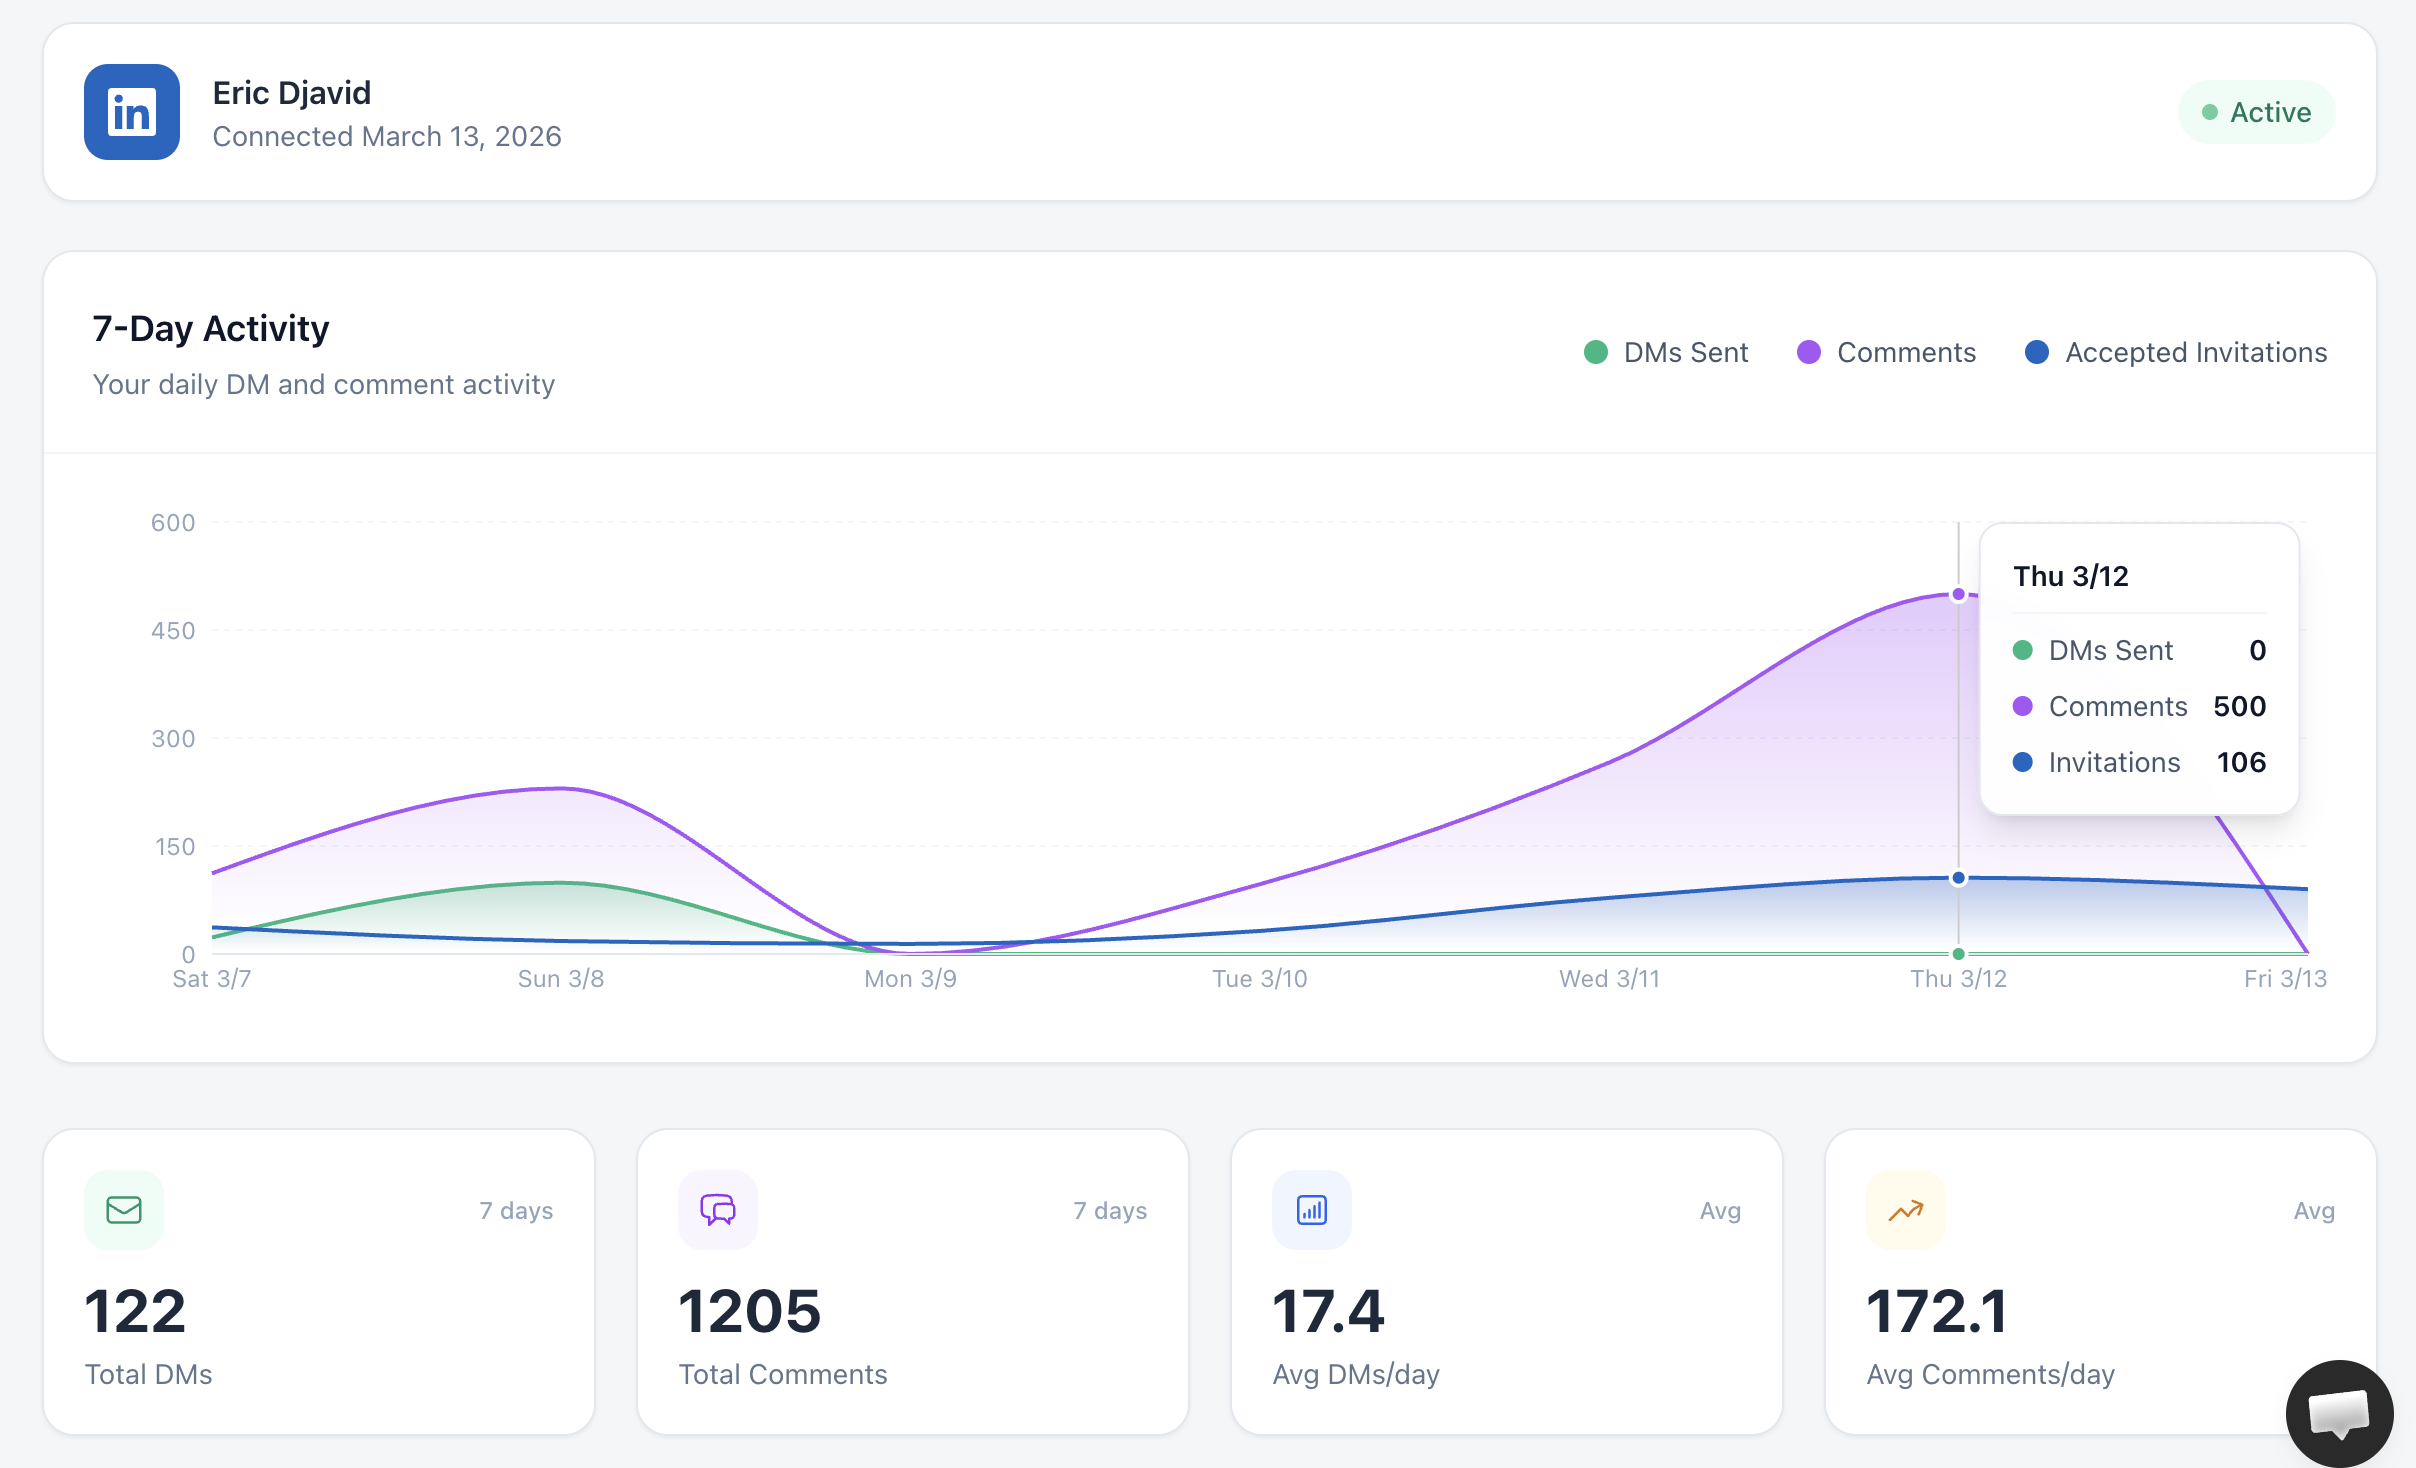
Key metrics
●
DMs sent — Number of direct messages sent by your automations
●
Comments — Automatic replies posted under your posts
●
Invitations accepted — Connection requests automatically accepted
Good to know
Statistics are updated in real time. You can filter by automation or by period to analyze your results more precisely.